SmartVueTM can monitor and log virtually all parameters in the J1939 standard and can also be configured to read manufacturer specific parameters that are not part of the standard. In this example we will monitor common parameters like Engine Speed, Oil Pressure and Coolant Temperature and a couple emissions parameters available in engines that meet the EPA Tier 4 Emissions Standard.
Connecting to the J1939 Data Bus
The SmartVueTM connects to the J1939 bus as shown in the diagram below. Standard J1939 Deutsch connectors and terminators are readily available for this purpose.
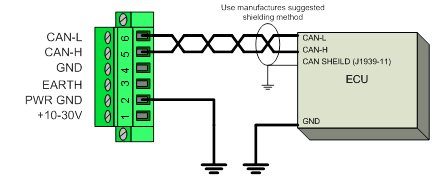
Note:120 ohm terminating resistors must be used on the first and last nodes.
Enabling J1939 Communications
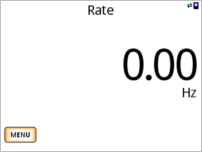
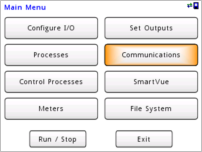
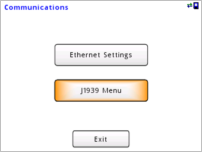
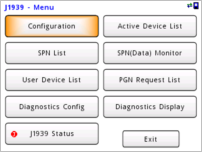
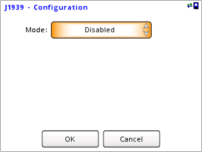
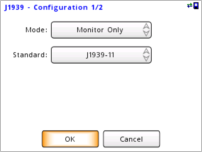
First we will configure the SmartVueTM to receive J1939 data by selecting “Monitor only” mode with the standard set to “J1939-11”. More advanced features for example obtaining the device list (ECU list), PGN Requests, and arbitrary address management require bi-directional communication and can be turned on by selecting “Send & Receive” mode.
Adding J1939 Suspect Parameter Numbers
Now that the SmartVueTM is configured to receive J1939 messages it is time to add the Suspect Parameter Numbers (SPN’s) that we want to monitor to the “SPN List”. If you know the SPN’s they can be added manually or we can pick from the list of SPN’s that are actively being transmitted on the J1939 bus. Next we can select the ECU address that we want to receive the SPN data from which it is useful in systems that contain multiple ECU’s that transmit the same information. In this case the Engine #1 ECU is located at a fixed address of 0.
Connecting to a single ECU
If connecting to a single ECU “Send and Receive” mode must be selected to acknowledge the ECU’s CAN message frames. “Monitor Only” mode does not acknowledge CAN message frames and can only be used if there is already active communications between multiple ECU’s.
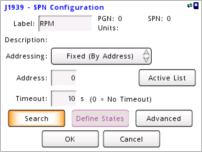
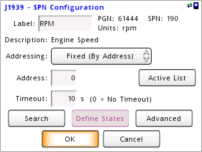
First we will add “Engine Speed” to the SPN list and label it “RPM”.


Next we can select the ECU address that we want to receive the SPN data from which is useful in systems that contain multiple ECU’s that transmit the same information. In this case the Engine #1 ECU is located at a fixed address of 0.
At this point we can also choose a timeout value to produce an error if data is not received within the specified period. If the timeout is set to zero (no timeout) and there is a loss of communications no error will be generated and the last SPN data value successfully received will be used indefinitely. For this example let’s set the timeout to 10 seconds.


Arbitrary Addressing Mode
Arbitrary addressing is also supported for advanced J1939 implementations where the ECU addresses can change dynamically. This is accomplished by tracking the ECU by its device name attributes.
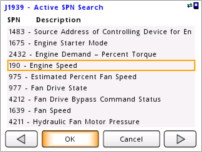
Since we are connected to an active J1939 network let’s choose the SPN we want to monitor by searching active SPN’s. Navigate through the pages and select SPN 190 “Engine Speed”.
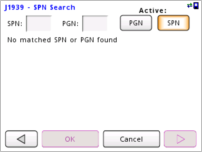
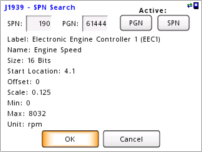
Once SPN 190 “Engine Speed” is selected more detailed information about the SPN is displayed including the standard scaling information and units. Press “Ok” twice to view the “SPN List”.
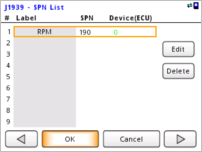
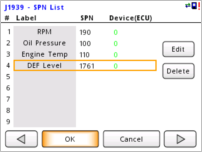
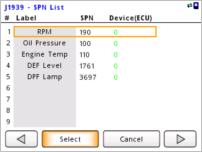
The SPN list now contains the SPN 190 from device address 0. Let’s repeat the steps above and add SPN 100 “Engine Oil Pressure”, SPN 110 “Engine Coolant Temperature” and SPN 1761 “Diesel Exhaust Fluid Tank Level”. The “SPN List” should now look like the one below.
SPN/PGN Active Search
The active search function shows all active SPN’s/PGN’s currently being transmitted from all ECU’s
Manufacturer Specific SPN’s
SPN’s that are not part of the standard can be configured using the “Advanced” settings option.
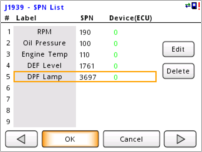
Now let’s add SPN 3697 which is used to control the “Diesel Particulate Lamp” that illuminates when active regeneration is required.
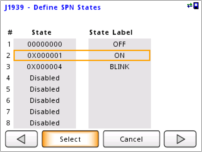
The “Define States” option is available for all SPN’s that relay state information and can be used to label each state. In this case we will label the following three states:
0x0 = “OFF”
0x1 = “ON”
0x4 = “BLINK”
If an SPN with state data is displayed on the meter screen the state labels or hexadecimal value can be displayed.


Now there should be 5 SPN’s configured and displayed in the “SPN List”. Each SPN configured can be used in processes so they can be displayed on the meter screen and/or used to directly control outputs.
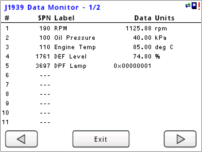
Up to 16 SPN’s can be added and directly monitored on the “J1939 Data Monitor” screen, logged to a .csv file and streamed to a remote PC via Ethernet.
SPN/PGN Active Search
The active search function shows all active SPN’s/PGN’s currently being transmitted from all ECU’s
Manufacturer Specific SPN’s
SPN’s that are not part of the standard can be configured using the “Advanced” settings option.
Linking SPN Data to a Process
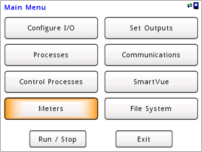
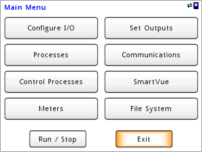
If we want SPN data to be displayed on a meter screen or used to control an output it must first be linked to a process. From the “Main Menu” enter the “Processes” menu and select “Process 1”. Change the name to “Engine RPM” change the “Type” to “J1939 SPN” and press the “Input” button to bring up the SPN list. From the SPN list select SPN 1 “RPM”.
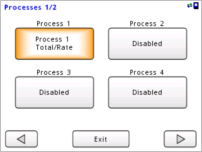
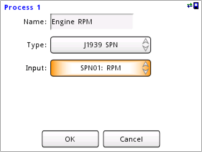
Press “OK” to save “Process 1” and configure four more processes for the remaining four SPN’s. The “Processes” screens should look like the ones below.
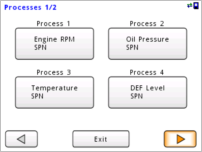
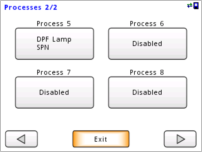
Configuring the Meter Display
Now that we have a process linked to each SPN we can display the process data on the meter screen and/or control outputs based on the processes SPN value.
Let’s configure four meters to display RPM, oil pressure, temperature, and diesel exhaust fluid level.
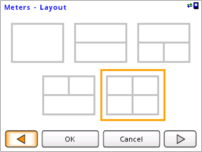
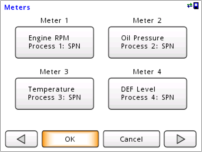
Select “Meters” from the “Main Menu” and navigate right to the “Meters – Layout” screen and select the four meter layout box. Now when you navigate back there will be four meter configuration buttons.
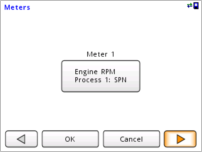
Press “Meter 1” and configure it to display data from “Process 1”. Repeat for meters 2,3 and 4 selecting “Process 2”, “Process 3” and “Process 4” respectively.
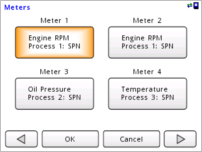
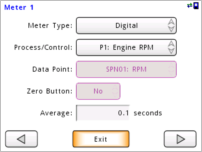

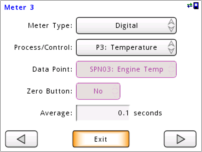

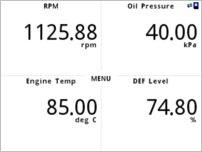
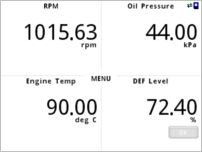
Now that all four meters are configured exit the “Main Menu” to view the meter screen. You should now see the RPM, Oil Pressure, Engine Temperature and DEF Level. If the communications is interrupted for more than the configured timeout of 10 seconds the meter screen will display “TIMEOUT” in red.
Additional Meter Options
The meters can be configured as graphs and can display averaged values. See Users Manual.
Controlling an Output using J1939 Data
Now that we have the meter configured to display the first four engine parameters let’s configure a digital output to switch low whenever the active regeneration lamp is signaled to illuminate. This can be done by linking “Process 5” (DPF Lamp) to a digital output.
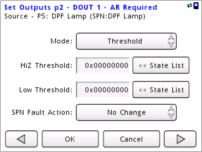
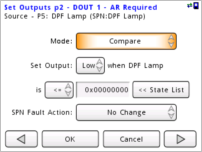
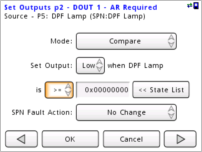
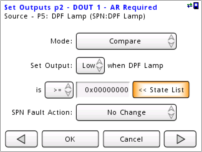
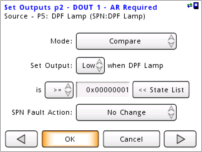
In this case there are three possible output modes to choose from “Compare”, “Threshold” and “Latching”. We will use the “Compare” mode to set the output “Low” when the DPF Lamp is “>=” “0×00000001”. You can either type the hexadecimal compare value in manually or choose it from the “State List”.
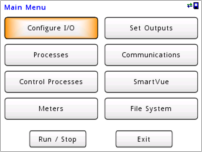
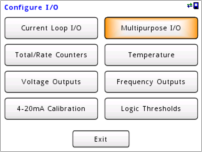
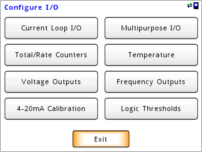
We start by configuring the Multipurpose I/O channel #1 as an output. From the “Main Menu” select “Configure I/O”, “Multipurpose I/O” then “DIO/VIN 1”.
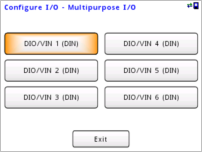
Change the “I/O Type” to “Digital Output” and fill in the text fields as shown below.
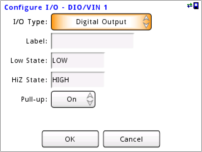
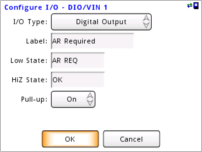
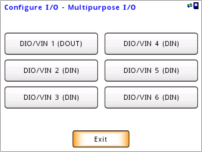
Now let’s link digital output #1 to “Process 5” (DPF Lamp). From the “Main Menu” select “Set Outputs” navigate to the right and select “DOUT 1”. Set “Enabled” to “Yes” and select “P5: DPF Lamp” then navigate right to configure the output mode.
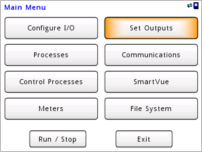
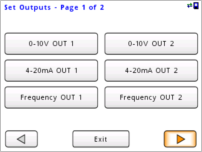
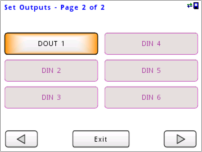
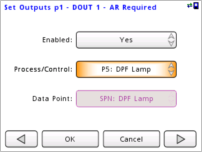
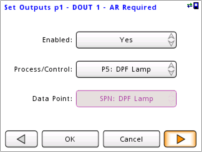
In this case there are three possible output modes to choose from “Compare”, “Threshold” and “Latching. We will use the “Compare” mode to set the output “Low” when the DPF Lamp is “>=” “0x00000001”. You can either type the hexadecimal compare value in manually or choose it from the “State List”.
The output will now switch low whenever active regeneration is required.
SPN Fault Action
If the SPN that is connected to an output is not received in the time specified a fault will be generated. Use “SPN Fault Action” to specify the outputs preferred state during fault conditions.
Placing Indicators on a Meter
Now that we have the output configured we can display its state by placing an indicator on one of the meters. Let’s place the “Active Regeneration Required” indicator on “Meter 4”.
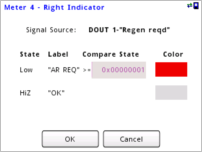
From the “Main Menu” select “Meters”, “Meter 4”. Each meter can display two indicators. Let’s enable the right indicator by navigating right until the “Meter 4 – Right Indicator” page is displayed. Select “DOUT 1-Regen reqd” as the signal source and fill out the “Low” and “HiZ” text fields as shown below. The indicator colors can also be adjusted for each state.
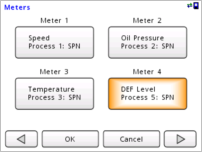
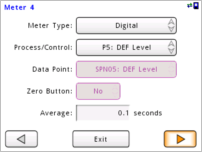
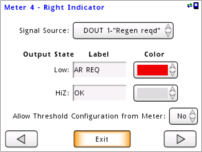
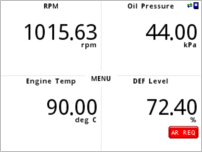
An indicator is now displayed on the DEF Level meter showing the state of the active regeneration output. Press the indicator button to display a summary of the indicator and output compare settings.
Indicator Buttons
The meter indicators buttons can be used to display digital input and output states and can also be used to directly switch outputs on and off, reset latched outputs, and adjust output threshold and compare values.
Adding active diagnostic information
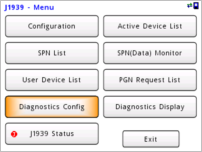
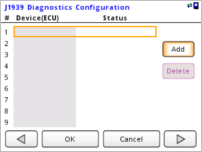
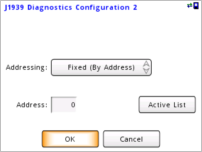
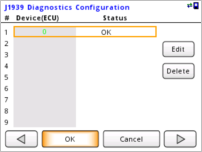
In the “Diagnostics Configuration” page press “Add” to add an ECU to monitor. Here we select the fixed addressing mode and set the address to 0 to receive DTC messages from the engine ECU. Once the ECU is added to the list the SmartVueTM will start receiving the active diagnostic codes. If a diagnostic code is received from any of the ECU’s configured the small DTC icon will show up on the top right corner of the screen.
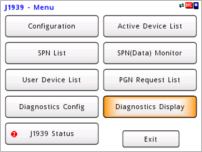
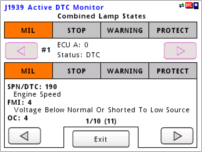
Use the “Diagnostics Display” feature to view detailed information for each DTC including the Malfunction indicator lamps, SPN, Failure Mode Identification (FMI) number, and Occurrence Count (OC).
The DTC codes can also be logged or streamed to a remote PC via Ethernet.
